Climate Change and Public Health
Climate change is affecting the health of Americans. As the climate continues to change, the risks to human health will grow, exacerbating existing health threats and creating new public health challenges.
Public Opinion on Climate Change and Public Health
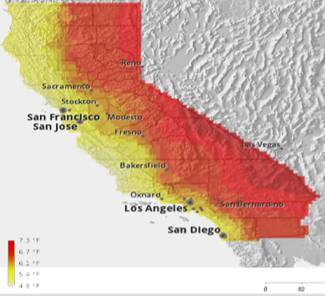
Figure 2, Average temperature increase across California
Portion of Americans who reported understanding climate change very well: 1/10
Portion of Americans who believe climate change is harming Americans right now: 1/3
Percent who rarely or never discuss climate change with family and friends [3]: 65
Percent of people who said they themselves had given the issue little or no thought [4]: 61
Percent of people who said they think climate change is bad for public health: 63
Climate Change and Increased Heat
Amount of projected temperature increase in degrees across US by 2100: 7
Number of days of extreme heat, with temperatures above the 98th percentile of computed maximum temperature for locations by 2050: 40-53
By 2099: 40-99
Estimated temperature in which the body can no longer cool itself through perspiration: 95
Number of days that extreme heat occurred historically per year in California: 4
Percent increase in mortality rates on extremely hot days for those with cardiovascular conditions: 28%
Number of deaths caused by the California Heat wave of 2006: 655
Climate Change and Environmental Disasters
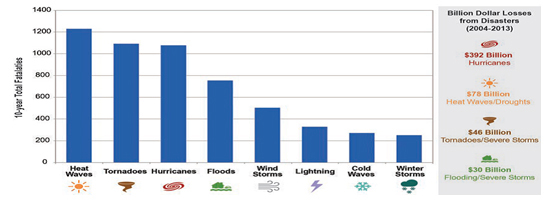
Figure 4, Estimated Deaths and Billion Dollar Losses from Extreme Events in the United States 2004–2013
Letter grade that the American Society of Civil Engineer’s Report Card of 2013 assigned to the condition and performance of the Nation’s infrastructure: D+
Number of deaths due to levee failure and subsequent flooding from Hurricane Katrina: 1300
Number of times since May of 2015 in which the amount of rainfall in an area in a specified window of time matches or exceeds the NOAA predictions for an amount of precipitation that will occur once every five hundred years: 8
Percent of water stores in Lake Mead and Lake Powell, fed by the Colorado River and which feed most of Southern California’s water supply since 1999 due to drought: 50
Number of fold increase of wildfire occurrence projected for the Western US between 2041 and 2070 compared to historical averages between 1971 and 2000: 6
Percent increase of people seeking emergency care due to peak fire particulate matter concentrations compared to non-fire conditions: 50
Climate Change and Respiratory Health
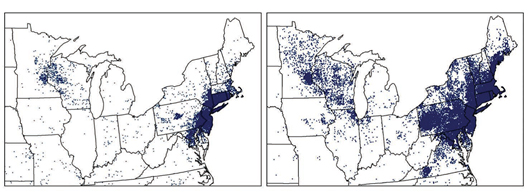
Figure 6, Maps show the reported cases of Lyme disease in 2001 and 2014 in the Midwest and Northeast.
Approximate number of Californians living with asthma: 3 million
Total direct and indirect cost of asthma in dollars to California annually: 11.3 billion
Total dollars in all healthcare costs to Californians due to ozone and particulate formation: 71 billion
In Californian lives lost every year: 8,800
Percent increase in days conducive to ozone formation across California due to increased temperatures between 2070-2099 when compared to 1961-1990: 75-85
Percent increase in infiltration of outdoor ozone particulates into indoor spaces due to increased temperatures between 2040–2070 when compared to 1970–2000: 25
Climate Change and Vector-Borne Disease
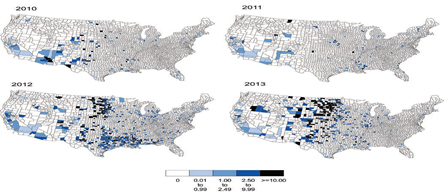
Figure 7, Maps show the incidence of West Nile neuro invasive disease in the United States for 2010 through 2013. Shown as cases per 100,000 people
Year in which CDC began collecting data on the spread of Lyme disease: 1991
Number of cases reported per 100,000 people in 1991?: 3.74
In 2015: 7.95
Year of first reported case of West Nile Virus in US: 1999
Number of reported cases of people in the United States between 1999 and 2013: 39,557
In California in 2014: 892
Amount of average time in weeks of peak activity for tick and mosquito seasons: 24
Additional weeks of tick and mosquito season due to climate change-induced increased temperatures: 2
Percent increase of habitat due to temperature increases in the United States for the Aedes aegypti, the mosquito that carries the West Nile and the Zika Viruses: 13
Climate Change and Equity
Percent by which African-Americans are more likely than Whites to live in areas where hard surfaces cover more than half the ground, and more than half the population lacks tree canopy, exacerbating risk of heat illness: 52
Asian-Americans: 32% more likely than Whites to live in these areas
Hispanic-Americans: 21% more likely than Whites to live in these areas
Percent increase in hospital admissions of elderly for respiratory illness per increase in degree Centigrade: 4.7
Portion of people of color in the San Francisco Bay Area who are more likely to be flooded due to climate change induced sea level rise: 1/2
Percent of people who died in the 2012 heat wave in Wisconsin, who had at least one mental illness and were prescribed medication that treats mental illness and sensitizes people to heat: 52
References
- The Impacts of Climate Change on Human Health: A Scientific Assessment, U.S. Global Change Research Program, https://health2016.globalchange.gov/
- Climate Change Knowledge 2010, Yale Project on Climate Change Communication. http://climatecommunication.yale.edu/publications/americans-knowledge-of-climate-change/
- Climate-Change-American-Mind-October-2015, Yale Project on Climate Change Communication. http://climatecommunication.yale.edu/publications/more-americans-perceive-harm-from-global-warming-survey-finds/
- Public Perceptions of The Health Consequences of Global Warming October 2014 This report is based on findings from a nationally representative survey – Climate Change in the American Mind– conducted by the Yale Project on Climate Change Communication and the George Mason University Center for Climate Change Communication. http://climatecommunication.yale.edu/wp-content/uploads/2014/12/Global-Warming-Public-Health-October_2014_FINAL-1.pdf
- Safeguarding California: Implementation Action Plans, Public Health Sector Plan, California Natural Resources Agency.http://resources.ca.gov/docs/climate/safeguarding/Public%20Health%20Sector%20Plan.pdf
- Our Changing Climate 2012: Vulnerability & Adaptation to the Increasing Risks from Climate Change in Californiahttp://www.energy.ca.gov/2012publications/CEC-500-2012-007/CEC-500-2012-007.pdf
- Flooding in the South Looks a Lot Like Climate Change, The New York Times, By Jonah Engel Bromwich http://www.nytimes.com/2016/08/17/us/climate-change-louisiana.html?_r=2
- When every drop counts: protecting public health during drought conditions— a guide for public health professionals. Atlanta: U.S. Department of Health and Human Services. Centers for Disease Control and Prevention, U.S. Environmental Protection Agency, National Oceanic and Atmospheric Agency, and American Water Works Association. 2010. https://www.cdc.gov/nceh/ehs/docs/when_every_drop_counts.pdf
- Strategic Plan for Asthma in California 2015–2019, The California Department of Public Healthhttps://www.cdph.ca.gov/HealthInfo/discond/Documents/Asthma/SPAC2015.PDF
- Our Changing Climate, Assessing the Risks to California, UCSD. http://meteora.ucsd.edu/cap/pdffiles/CA_climate_Scenarios.pdf
- 2014 Annual Report Vector-Borne Disease Section, Infectious Diseases Branch Division of Communicable Disease Control Center for Infectious Diseases, California Department of Public Health. https://www.cdph.ca.gov/programs/vbds/Documents/VBDSAnnualReport14.pdf
- The potential impacts of 21st century climatic and population changes on human exposure to the virus vector mosquito Aedes aegypti, Benefits of Reduced Anthropogenic Climate Change (BRACE), Springer Science+Business Media Dordrecht 2016. http://link.springer.com/article/10.1007/s10584-016-1679-0
- Jesdale BM, Morello-Frosch R, Cushing L. The racial/ethnic distribution of heat risk-related land cover in relation to residential segregation. Environ Health Perspect. 2013 Jul;121(7) 811-817.
- The Impacts Of Sea Level Rise On The San Francisco Bay, California Energy Commission’s California Climate Change Centerhttp://www.energy.ca.gov/2012publications/CEC-500-2012-014/CEC-500-2012-014.pdf